- 1. Getting Started
- 2. Organic Chemistry 101
-
3. First Semester Topics
-
Structure and Bonding
- Chemical Intuition
- Difficulty-in-organic-chemistry
- Atomic Orbitals
- Electron Configurations of Atoms
- Practice Time - Structure and Bonding 1
- Lewis Structures
- Drawing Lewis Structures Guide
- Valence Bond Theory
- Hybridization
- Polar Covalent Bonds
- Formal Charge
- Practice Time - Structure and Bonding 2
- Curved Arrow Notation
- Resonance
- Electrons behave like waves
- MO Theory Intro
- Rules of Thumb
- Structural Representations
- Acids/Base and Reactions
- Functional Groups
- Alkanes and Cycloalkanes
- Stereochemistry
-
Alkenes and Addition Reactions
- Application - BVO (Brominated Vegetable Oil)
- E/Z and CIP
- Stability of Alkenes
- H-X Addition to Alkenes: Hydrohalogenation
- Practice Time - Hydrohalogenation
- X2 Addition to Alkenes: Halogenation
- HOX addition: Halohydrins
- Practice Time - Halogenation
- Hydroboration/Oxidation of Alkenes: Hydration
- Practice Time - Hydroboration-Oxidation
- Oxymercuration-Reduction: Hydration
- Practice Time - Oxymercuration/Reduction
- Oxidation
- Reduction
- Alkynes
- Alcohols and Alkyl Halides
- Aliphatic Substitutions (SN1/SN2)
- Dienes, Allylic and Benzylic systems
-
Structure and Bonding
-
4. Second Semester Topics
- Arenes and Aromaticity
-
Reactions of Arenes
- Electrophilic Aromatic Substitution
- EAS-Halogenation
- EAS-Nitration
- Practice Time - Synthesis of Aniline
- EAS-Alkylation
- Practice Time - Friedel Crafts Alkylation
- EAS-Acylation
- Practice Time - Synthesis of Alkyl Arenes
- EAS-Sulfonation
- Practice Time - EAS
- Effect on Rate and Orientation
- Donation and Withdrawal of Electrons
- Regiochemistry in EAS
- Practice Time - Directing Group Effects
- Steric Considerations
- Synthesizing Poly-substituted Benzene's
- NAS - Addition/Elimination
- NAS - Elimination/Addition - Benzyne
- Alcohols and Phenols
-
Ethers and Epoxides
- Intro and Occurrence
- Crown Ethers
- Preparation of Ethers
- Reactions of Ethers
- Practice Time - Ethers
- Preparation of Epoxides
- Reactions of Epoxides - Acidic Ring Opening
- Practice Time - Acidic Ring Opening
- Reactions of Epoxides - Nucleophilic Ring Opening
- Practice Time - Nucleophilic Ring opening
- Application - Epoxidation in Reboxetine Synthesis
- Application - Nucleophilic Epoxide Ring Opening in Crixivan Synthesis
- Naming Ethers and Epoxides
-
Aldehydes and Ketones
- Naming Aldehydes and Ketones
- Practice Time - Naming Aldehydes/Ketones
- Nucleophilic addition
- Addition of Water - Gem Diols
- Practice Time - Hydration of Ketones and Aldehydes
- Addition of Alcohols - Hemiacetals and Acetals
- Acetal Protecting Groups
- Hemiacetals in Carbohydrates
- Practice Time - Hemiacetals and Acetals
- Addition of Amines - Imines
- Addition of Amines - Enamines
- Practice Time - Imines and Enamines
- Application - Imatinab Enamine Synthesis
- Addition of CN - Cyanohydrins
- Practice Time - Cyanohydrins
- Application - Isentress Synthesis
- Addition of Ylides - Wittig Reaction
- Practice Time - Wittig Olefination
- Carboxylic Acids and Derivatives
- Enols and Enolates
- Condensation Reactions
- 5. Spectroscopy - NMR, IR and UV
- 6. Mass Spectrometry
-
7. General Chemistry
- Significant Figures
- Practice Time! Significant Figures
- Spreadsheets - Getting Started
- Spreadsheets - Charts and Trend lines
- Standard Deviation
- Standard Deviation Calculations
- Factor Labels
- Practice Time! - Factor Labels
- Limiting Reagent Problem
- Percent Composition
- Molar Mass Calculation
- Average Atomic Mass
- Empirical Formula
- Initial Rate Analysis
- Practice Time! Initial Rate Analysis
- Solving Equilibrium Problems with ICE
- Practice Time! Equilibrium ICE Tables
- Le Chatelier's
-
8. Organic Chemistry Lab
- 9. General Chemistry Lab
- 10. Named Reactions
-
11. Reagents
-
12. Question Of The Day
- 13. Tutorials
- 14. Ask a Question
Clear History
Interpreting MS
Introduction to Mass Spectrometry Interpretation.
Here is a list of steps to follow when interpreting a mass spectrum. This simplified list will help you to interpret many spectra; however, keep in mind that there are other mechanisms of fragmentation which have not been included.
1. Look for the molecular ion peak.
- This peak (if it appears) will be the highest mass peak in the spectrum,
except for isotope peaks.- Nominal MW (meaning=rounded off) will be an even number for
compounds containing only C, H, 0, S, Si. - Nominal MW will be an odd number if the compound also contains an odd
number of N (1,3, ... ).
- Nominal MW (meaning=rounded off) will be an even number for
2. Try to calculate the molecular formula:
- The isotope peaks can be very useful, and are best explained with an
example.- Carbon 12 has an isotope, carbon 13. Their abundances are
12C=100, 13C=1.1 . This means that for every 100 (12)C atoms
there are 1.1 (13)C atoms. - If a compound contains 6 carbons, then each atom has a 1.1
abundance of (13)C. - Therefore, if the molecular ion peak is 100, then the isotope peak
(1 mass unit higher) would be 6x1.1 =6.6. - If the molecular ion peak is not 100 then you can calculate the
relative abundance of the isotope peak to the ion peak. For
example, if the molecular ion peak were 34 and the isotope peak
2.3: (2.3/34)x100 = 6.8. 6.8 is the relative abundance of the
isotope peak to the ion peak. Next, divide the relative abundance
by the isotope abundance: 6.8/1.1 =6 carbons. - Follow this order when looking for information provided by isotopes: (A
simplified table of isotopes is provided in the introduction, more detailed
tables can be found in chemistry texts.)- Look for A+2 elements: 0, Si, S, CI, Br
- Look for A+1 elements: C, N
- "A" elements: H, F, P, I
- Carbon 12 has an isotope, carbon 13. Their abundances are
3. Calculate the degree of unsaturation (i.e. total number of rings plus double bonds):
- For the molecular formula: CxHyNzOn
degree of unsaturation = x - (1/2)y + (1/2)z + 1
4. Postulate the molecular structure consistent with abundance and m/z of
fragments.
The following example is the mass spectrum for methanol.
|
Ions |
m/z |
|
CH3OH+ |
32 |
|
H2C=OH+ |
31 |
|
HC=O+ |
29 |
|
CH3+ |
15 |
General Information to assist you in EI mass spectra interpretation
Molecular ion (M+): If the molecular ion appears, it will be the highest mass in an EI spectrum (except for isotope peaks discussed below). This peak will represent the molecular weight of the compound. Its appearance depends on the stability of the compound. Double bonds, cyclic structures and aromatic rings stabilize the molecular ion and increase the probability of its appearance.
Reference Spectra: Mass spectral patterns are reproducible. The mass spectra
of many compounds have been published and may be used to identify
unknowns. Instrument computers generally contain spectral libraries which can
be searched for matches.
Fragmentation: General rules of fragmentation exist and are helpful to predict or
interpret the fragmentation pattern produced by a compound. Functional groups
and overall structure determine how some portions of molecules will resist
fragmenting, while other portions will fragment easily.
Isotopes: Isotopes occur in compounds analyzed by mass spectrometry in the
same abundances that they occur in nature. A few of the isotopes commonly
encountered in the analyses of organic compounds are below along with an
example of how they can aid in peak identification.
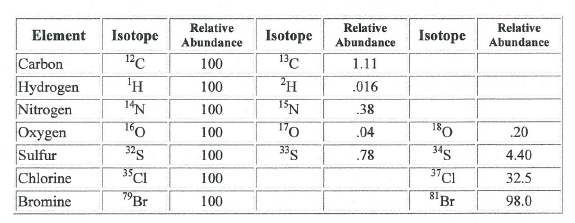
The ratio of peaks containing 79Br and its isotope 81Br (100/98) confirms the presence of bromine in the compound.
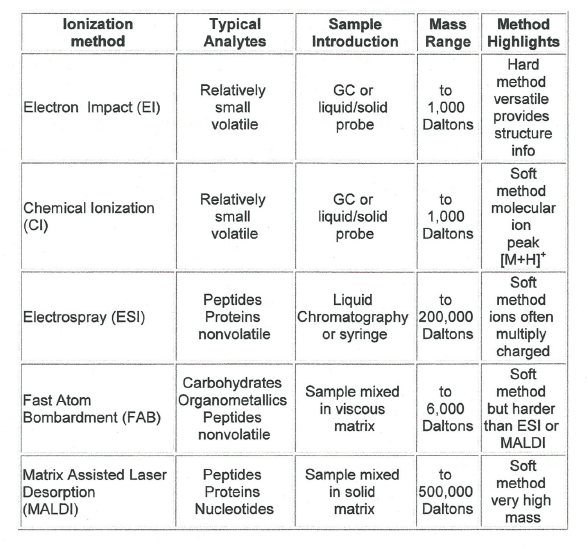
Different Types of Ionization Methods and Sample Introduction Techniques
An array of ionization methods and mass analyzers are available to meet the needs of many types of chemical analysis. A few are listed here with a highlight of their usefulness.