- 1. Getting Started
-
2.
First Semester Topics
-
General Chemistry Review
- Introduction
- Electron Configurations of Atoms
- QM Description of Orbitals
- Practice Time - Electron Configurations
- Hybridization
- Closer Look at Hybridization
- Strategy to Determine Hybridization
- Practice Time! - Hybridization
- Formal Charge
- Practice Time - Formal Charge
- Acids-bases
- Practice Time - Acids and Bases
- Hydrogen Bonding is a Verb!
- Progress Pulse
-
Structure and Bonding
- Chemical Intuition
- From Quantum Mechanics to the Blackboard: The Power of Approximations
- Atomic Orbitals
- Electron Configurations of Atoms
- Electron Configurations Tutorial
- Practice Time - Structure and Bonding 1
- Lewis Structures
- Drawing Lewis Structures
- Valence Bond Theory
- Valence Bond Theory Tutorial
- Hybridization
- Polar Covalent Bonds
- Formal Charge
- Practice Time - Structure and Bonding 2
- Curved Arrow Notation
- Resonance
- Electrons behave like waves
- MO Theory Intro
- Structural Representations
- Progress Pulse
-
Acids/Base and Reactions
- Reactions
- Reaction Arrows: What do they mean?
- Thermodynamics of Reactions
- Acids Intro
- Practice Time! Generating a conjugate base.
- Lewis Acids and Bases
- pKa Scale
- Practice Time! pKa's
- Predicting Acid-Base Reactions from pKa
- Structure and Acidity
- Structure and Acidity II
- Practice Time! Structure and Acidity
- Curved Arrows and Reactions
- Nucleophiles
- Electrophiles
- Practice Time! Identifying Nucleophiles and Electrophiles
- Mechanisms and Arrow Pushing
- Practice Time! Mechanisms and Reactions
- Energy Diagrams and Reactions
- Practice Time! - Energy Diagrams
- Progress Pulse
- Introduction to Retrosynthesis
-
Alkanes and Cycloalkanes
- Introduction to Hydrocarbons and Alkanes
- Occurrence
- Functional Groups
- Practice Time! Functional Groups.
- Structure of Alkanes - Structure of Methane
- Structure of Alkanes - Structure of Ethane
- Naming Alkanes
- Practice Time! Naming Alkanes
- Alkane Isomers
- Relative Stability of Acyclic Alkanes
- Physical Properties of Alkanes
- Ranking Boiling Point and Solubility of Compounds
- Conformations of Acyclic Alkanes
- Practice Time! Conformations of acyclic alkanes.
- Conformations of Cyclic Alkanes
- Naming Bicyclic Compounds
- Stability of Cycloalkane (Combustion Analysis)
- Degree of Unsaturation
-
Stereochemistry
- Enalapril in ACE
- Constitutional and Stereoisomers
- Chirality or Handedness
- Drawing a Molecules Mirror Image
- Exploring Mirror Image Structures
- Enantiomers
- Drawing Enantiomers
- Practice Time! Drawing Enantiomers
- Identifying Chiral Centers
- Practice Time! Identifying Chiral Molecules
- CIP (Cahn-Ingold-Prelog) Priorities
- Determining R/S Configuration
- Diastereomers
- Meso Compounds
- Fischer Projections
- Fischer Projections: Carbohydrates
- Measuring Chiral Purity
- Practice Time! - Determining Chiral Purity and ee
- Chirality and Drugs
- Chiral Synthesis
- Prochirality
- Converting Fischer Projections to Zig-zag Structures
- Practice Time! - Assigning R/S Configurations
-
Alkenes and Addition Reactions
- The Structure of Alkenes
- Alkene Structure - Ethene
- Physical Properties of Alkenes
- Naming Alkenes
- Health Insight - BVO (Brominated Vegetable Oil)
- E/Z and CIP
- Stability of Alkenes
- H-X Addition to Alkenes: Hydrohalogenation
- Practice Time - Hydrohalogenation
- X2 Addition to Alkenes: Halogenation
- HOX addition: Halohydrins
- Practice Time - Halogenation
- Hydroboration/Oxidation of Alkenes: Hydration
- Practice Time - Hydroboration-Oxidation
- Oxymercuration-Reduction: Hydration
- Practice Time - Oxymercuration/Reduction
- Oxidation and Reduction in Organic Chemistry
- Calculating Oxidation States of Carbon
- Identifying oxidation and reduction reactions
- Practice Time - Oxidation and Reduction in Organic
- Oxidation
- Reduction
- Capsaicin
-
Alkynes
- Structure of Ethyne (Acetylene)
- Naming Alkynes
- Practice Time! - Naming Alkynes
- Physical Properties of Alkynes
- Preparation of Alkynes
- Practice Time! - Preparation of Alkynes
- H-X Addition to Alkynes
- X2 Addition
- Hydration
- Reduction of Alkynes
- Practice Time! - Addition Reactions of Alkynes
- Oxidative Cleavage of Alkynes
- Alkyne Acidity and Acetylide Anions
- Reactions of Acetylide Anions
- Retrosynthesis Revisted
- Practice Time! - Multistep Synthesis Using Acetylides
-
Alkyl Halides and Alcohol
- Naming Alkyl Halides
- Naming Alcohols
- Classes of Alcohols and Alkyl Halides
- Practice Time! - Naming Alkyl Halides
- Practice Time! - Naming Alcohols
- Physical Properties of Alcohols and Alkyl Halides
- Structure and Reactivity of Alcohols
- Structure and Reactivity of Alkyl Halides
- Preparation of Alkyl Halides and Tosylates from Alcohols
- Practice Time! - Alcohols to Alkyl Halides
- Preparation of Alkyl Halides from Alkenes; Allylic Bromination
- Strategy for Predicting Products of Allylic Brominations
- Practice Time! - Allylic Bromination
- Substitutions (SN1/SN2) and Eliminations (E1/E2)
- Dienes, Allylic and Benzylic systems
-
General Chemistry Review
-
3.
Second Semester Topics
- Arenes and Aromaticity
-
Reactions of Arenes
- Electrophilic Aromatic Substitution
- EAS-Halogenation
- EAS-Nitration
- Practice Time - Synthesis of Aniline
- EAS-Alkylation
- Practice Time - Friedel Crafts Alkylation
- EAS-Acylation
- Practice Time - Synthesis of Alkyl Arenes
- EAS-Sulfonation
- Practice Time - EAS
- Donation and Withdrawal of Electrons
- Regiochemistry in EAS
- Practice Time - Directing Group Effects
- Synthesizing Disubstituted Benzenes: Effects of Substituents on Rate and Orientation
- Steric Considerations
- Strategies for Synthesizing Disubstituted Benzenes
- NAS - Addition/Elimination
- NAS - Elimination/Addition - Benzyne
- Alcohols and Phenols
-
Ethers and Epoxides
- Intro and Occurrence
- Crown Ethers and Cryptands
- Preparation of Ethers
- Reactions of Ethers
- Practice Time - Ethers
- Preparation of Epoxides
- Reactions of Epoxides - Acidic Ring Opening
- Practice Time - Acidic Ring Opening
- Reactions of Epoxides - Nucleophilic Ring Opening
- Practice Time - Nucleophilic Ring opening
- Application - Epoxidation in Reboxetine Synthesis
- Application - Nucleophilic Epoxide Ring Opening in Crixivan Synthesis
- Physical Properties of Ethers and Epoxides
- Naming Ethers and Epoxides
-
Aldehydes and Ketones
- Naming Aldehydes and Ketones
- Physical Properties of Ketones and Aldehydes
- Practice Time - Naming Aldehydes/Ketones
- Nucleophilic addition
- Addition of Water - Gem Diols
- Practice Time - Hydration of Ketones and Aldehydes
- Addition of Alcohols - Hemiacetals and Acetals
- Acetal Protecting Groups
- Hemiacetals in Carbohydrates
- Practice Time - Hemiacetals and Acetals
- Addition of Amines - Imines
- Addition of Amines - Enamines
- Practice Time - Imines and Enamines
- Application - Imatinab Enamine Synthesis
- Addition of CN - Cyanohydrins
- Practice Time - Cyanohydrins
- Application - Isentress Synthesis
- Addition of Ylides - Wittig Reaction
- Practice Time - Wittig Olefination
- Structure of Ketones and Aldehydes
- Carboxylic Acids and Derivatives
- Enols and Enolates
- Condensation Reactions
- 4. Spectroscopy - NMR, IR and UV
-
5.
General Chemistry
- General Chemistry Lab
- Strategy for Balancing Chemical Reactions
- Calculator Tips for Chemistry
- Significant Figures
- Practice Time! Significant Figures
- Spreadsheets - Getting Started
- Spreadsheets - Charts and Trend lines
- Standard Deviation
- Standard Deviation Calculations
- Factor Labels
- Practice Time! - Factor Labels
- Limiting Reagent Problem
- Percent Composition
- Molar Mass Calculation
- Average Atomic Mass
- Empirical Formula
- Practice time! Empirical and Molecular Formulae
- Initial Rate Analysis
- Practice Time! Initial Rate Analysis
- Solving Equilibrium Problems with ICE
- Practice Time! Equilibrium ICE Tables
- Le Chatelier's
- Practice Time! Le Chatelier's Principle
- 6. Organic Chemistry Lab
-
7.
Question Of The Day
- 8. Tools and Reference
-
9.
Tutorials
- Reaction Mechanisms (introduction)
- Factor Labels
- Acetylides and Synthesis
- Drawing Cyclohexane Chair Structures
- Drawing Lewis Structures
- Aromaticity Tutorial
- Common Named Aromatics (Crossword Puzzle)
- Functional Groups (Flashcards)
- Characteristic Reactions of Functional Groups
- Alkyl and Alkenyl Groups
- Valence Bond Theory
- Alkane Nomenclature
Clear History
Interpreting IR Spectra
Getting Around an IR Spectra
Because the wavelength range of IR radiation useful in vibraional spectroscopy has wavelengths which are rather small numbers (i.e about 2.5x10⁻⁶ to 25x10-6 meters) chemists have devised an alternative units of reciprocal centimeters (cm-1). This is sometimes referred to as wave-number and is the x-axis on an IR spectra. The useful range for molecules is between 4000 cm-1 and about 400 cm-1. Wave-number is really a measure of energy and higher energy is to the left and lower energy is to the right on a spectra. Vibrational modes with high energy will show up on the left and those with lower energy will be on the right.
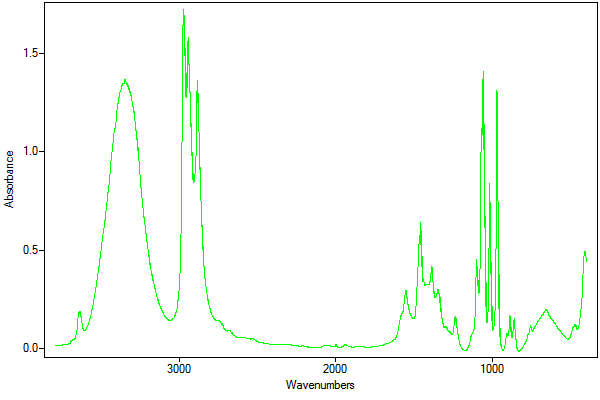
The y-axis is either the intensity of light absorbed or transmitted. In an absorbance spectra the signal intensity indicates the amount of light absorbed. The signals or features you are looking for are peaks in an absorbance spectra. In a transmittance spectra the signal intensity shows the amount of light that passed through (transmitted) the sample. In a transmittance spectra you/re looking for valleys (or upside down peaks). They can be inter-converted by using A=-log(T/100). Most FTIR will do the conversion for you. Below are the transmittance and absorbance spectra for 1-propanol.


Absorbance Spectra (1-propanol)
.png)
Transmittance Spectra (1-propanol)
![]()
General Procedure for Interpreting IR Spectra (Beginner)
There are three regions of an IR spectra from which most of the info you will use in organic chemistry will come from.
- O-H and N-H Stretch Region - On the left (high energy end of the spectra) look for -O-H, N-H (3600-3300 cm-1). The OH signal is usually broad strong absorption. N-H are less broad and strong.
- In the spectra above for 1-propanol a broad strong absorbance is observed in this region.
- In the spectra above for 1-propanol a broad strong absorbance is observed in this region.
- C-H Stretch Region - Look at the 3000 cm-1 part of the spectra. In this region lie the C-H stretches. The C-H stretches will have slightly different wave-numbers depending upon whether the H's are attached to sp3, sp2 or sp carbons. Just to the right of the 3000 cm-1 line will lie the sp3 C-H stretches (3000-2800 cm-1). To the left of the 3000 cm-1 at a slightly higher energy will lie the sp2 C-H (3200-3000 cm-1). And further to the left of these will lie the sp C-H absorbances (3300-3200cm-1).
- As expected the 1-propanol spectra above has signals for sp3 C-H (to the right of the 3000 cm-1 line) but not for sp or sp2 C-H.
- As expected the 1-propanol spectra above has signals for sp3 C-H (to the right of the 3000 cm-1 line) but not for sp or sp2 C-H.
- C=O Stretch Region - Check for the existence of a carbonyl (C=O) stretch around 1700 cm-1.
- There are no C=O in 1-propanol, and therefore an absorbance at 1700 cm-1 is not observed.
Why are C-H and N-H signals in the high energy end of the spectrum?
When a heavy atom (C, O, N) is bound to a light atom such as H the vibration is at a higher frequency (energy). See Hooke's law for a harmonic oscillator. Assume one of the m1 is infinite then examine the dependence of frequency on mass m2.
Why are sp C-H stretches at a higher energy than sp3 C-H stretches?
Again see Hookes law. In this case an sp C-H bond has a greater spring constant (stronger bond) than an sp3 C-H bond and therefore a higher frequency of vibration.