- 1. Getting Started
-
2.
First Semester Topics
-
General Chemistry Review
- Introduction
- Electron Configurations of Atoms
- QM Description of Orbitals
- Practice Time - Electron Configurations
- Hybridization
- Closer Look at Hybridization
- Strategy to Determine Hybridization
- Practice Time! - Hybridization
- Formal Charge
- Practice Time - Formal Charge
- Acids-bases
- Practice Time - Acids and Bases
- Hydrogen Bonding is a Verb!
- Progress Pulse
-
Structure and Bonding
- Chemical Intuition
- From Quantum Mechanics to the Blackboard: The Power of Approximations
- Atomic Orbitals
- Electron Configurations of Atoms
- Electron Configurations Tutorial
- Practice Time - Structure and Bonding 1
- Lewis Structures
- Drawing Lewis Structures
- Valence Bond Theory
- Valence Bond Theory Tutorial
- Hybridization
- Polar Covalent Bonds
- Formal Charge
- Practice Time - Structure and Bonding 2
- Curved Arrow Notation
- Resonance
- Electrons behave like waves
- MO Theory Intro
- Structural Representations
- Progress Pulse
-
Acids/Base and Reactions
- Reactions
- Reaction Arrows: What do they mean?
- Thermodynamics of Reactions
- Acids Intro
- Practice Time! Generating a conjugate base.
- Lewis Acids and Bases
- pKa Scale
- Practice Time! pKa's
- Predicting Acid-Base Reactions from pKa
- Structure and Acidity
- Structure and Acidity II
- Practice Time! Structure and Acidity
- Curved Arrows and Reactions
- Nucleophiles
- Electrophiles
- Practice Time! Identifying Nucleophiles and Electrophiles
- Mechanisms and Arrow Pushing
- Practice Time! Mechanisms and Reactions
- Energy Diagrams and Reactions
- Practice Time! - Energy Diagrams
- Progress Pulse
- Introduction to Retrosynthesis
-
Alkanes and Cycloalkanes
- Introduction to Hydrocarbons and Alkanes
- Occurrence
- Functional Groups
- Practice Time! Functional Groups.
- Structure of Alkanes - Structure of Methane
- Structure of Alkanes - Structure of Ethane
- Naming Alkanes
- Practice Time! Naming Alkanes
- Alkane Isomers
- Relative Stability of Acyclic Alkanes
- Physical Properties of Alkanes
- Ranking Boiling Point and Solubility of Compounds
- Conformations of Acyclic Alkanes
- Practice Time! Conformations of acyclic alkanes.
- Conformations of Cyclic Alkanes
- Naming Bicyclic Compounds
- Stability of Cycloalkane (Combustion Analysis)
- Degree of Unsaturation
-
Stereochemistry
- Enalapril in ACE
- Constitutional and Stereoisomers
- Chirality or Handedness
- Drawing a Molecules Mirror Image
- Exploring Mirror Image Structures
- Enantiomers
- Drawing Enantiomers
- Practice Time! Drawing Enantiomers
- Identifying Chiral Centers
- Practice Time! Identifying Chiral Molecules
- CIP (Cahn-Ingold-Prelog) Priorities
- Determining R/S Configuration
- Diastereomers
- Meso Compounds
- Fischer Projections
- Fischer Projections: Carbohydrates
- Measuring Chiral Purity
- Practice Time! - Determining Chiral Purity and ee
- Chirality and Drugs
- Chiral Synthesis
- Prochirality
- Converting Fischer Projections to Zig-zag Structures
- Practice Time! - Assigning R/S Configurations
-
Alkenes and Addition Reactions
- The Structure of Alkenes
- Alkene Structure - Ethene
- Physical Properties of Alkenes
- Naming Alkenes
- Health Insight - BVO (Brominated Vegetable Oil)
- E/Z and CIP
- Stability of Alkenes
- H-X Addition to Alkenes: Hydrohalogenation
- Practice Time - Hydrohalogenation
- X2 Addition to Alkenes: Halogenation
- HOX addition: Halohydrins
- Practice Time - Halogenation
- Hydroboration/Oxidation of Alkenes: Hydration
- Practice Time - Hydroboration-Oxidation
- Oxymercuration-Reduction: Hydration
- Practice Time - Oxymercuration/Reduction
- Oxidation and Reduction in Organic Chemistry
- Calculating Oxidation States of Carbon
- Identifying oxidation and reduction reactions
- Practice Time - Oxidation and Reduction in Organic
- Oxidation
- Reduction
- Capsaicin
-
Alkynes
- Structure of Ethyne (Acetylene)
- Naming Alkynes
- Practice Time! - Naming Alkynes
- Physical Properties of Alkynes
- Preparation of Alkynes
- Practice Time! - Preparation of Alkynes
- H-X Addition to Alkynes
- X2 Addition
- Hydration
- Reduction of Alkynes
- Practice Time! - Addition Reactions of Alkynes
- Oxidative Cleavage of Alkynes
- Alkyne Acidity and Acetylide Anions
- Reactions of Acetylide Anions
- Retrosynthesis Revisted
- Practice Time! - Multistep Synthesis Using Acetylides
-
Alkyl Halides and Alcohol
- Naming Alkyl Halides
- Naming Alcohols
- Classes of Alcohols and Alkyl Halides
- Practice Time! - Naming Alkyl Halides
- Practice Time! - Naming Alcohols
- Physical Properties of Alcohols and Alkyl Halides
- Structure and Reactivity of Alcohols
- Structure and Reactivity of Alkyl Halides
- Preparation of Alkyl Halides and Tosylates from Alcohols
- Practice Time! - Alcohols to Alkyl Halides
- Preparation of Alkyl Halides from Alkenes; Allylic Bromination
- Strategy for Predicting Products of Allylic Brominations
- Practice Time! - Allylic Bromination
-
Substitutions (SN1/SN2) and Eliminations (E1/E2)
- Introduction
- Solvents
- SN1 Reaction: The Carbocation Pathway
- SN2 Reactions: The Concerted Backside Attack
- SN1 vs. SN2: Choosing the Right Path
- Application: Cardura (Doxazosin)
- E1 Reactions: Elimination via Carbocations
- E2 Reactions: The Concerted Elimination
- E1cB: The Conjugate Base Elimination Pathway
- Substitution versus Elimination
- Dienes, Allylic and Benzylic systems
-
General Chemistry Review
-
3.
Second Semester Topics
- Arenes and Aromaticity
-
Reactions of Arenes
- Electrophilic Aromatic Substitution
- EAS-Halogenation
- EAS-Nitration
- Practice Time - Synthesis of Aniline
- EAS-Alkylation
- Practice Time - Friedel Crafts Alkylation
- EAS-Acylation
- Practice Time - Synthesis of Alkyl Arenes
- EAS-Sulfonation
- Practice Time - EAS
- Donation and Withdrawal of Electrons
- Regiochemistry in EAS
- Practice Time - Directing Group Effects
- Synthesizing Disubstituted Benzenes: Effects of Substituents on Rate and Orientation
- Steric Considerations
- Strategies for Synthesizing Disubstituted Benzenes
- NAS - Addition/Elimination
- NAS - Elimination/Addition - Benzyne
- Alcohols and Phenols
-
Ethers and Epoxides
- Intro and Occurrence
- Crown Ethers and Cryptands
- Preparation of Ethers
- Reactions of Ethers
- Practice Time - Ethers
- Preparation of Epoxides
- Reactions of Epoxides - Acidic Ring Opening
- Practice Time - Acidic Ring Opening
- Reactions of Epoxides - Nucleophilic Ring Opening
- Practice Time - Nucleophilic Ring opening
- Application - Epoxidation in Reboxetine Synthesis
- Application - Nucleophilic Epoxide Ring Opening in Crixivan Synthesis
- Physical Properties of Ethers and Epoxides
- Naming Ethers and Epoxides
-
Aldehydes and Ketones
- Naming Aldehydes and Ketones
- Physical Properties of Ketones and Aldehydes
- Practice Time - Naming Aldehydes/Ketones
- Nucleophilic addition
- Addition of Water - Gem Diols
- Practice Time - Hydration of Ketones and Aldehydes
- Addition of Alcohols - Hemiacetals and Acetals
- Acetal Protecting Groups
- Hemiacetals in Carbohydrates
- Practice Time - Hemiacetals and Acetals
- Addition of Amines - Imines
- Addition of Amines - Enamines
- Practice Time - Imines and Enamines
- Application - Imatinab Enamine Synthesis
- Addition of CN - Cyanohydrins
- Practice Time - Cyanohydrins
- Application - Isentress Synthesis
- Addition of Ylides - Wittig Reaction
- Practice Time - Wittig Olefination
- Structure of Ketones and Aldehydes
- Carboxylic Acids and Derivatives
- Enols and Enolates
- Condensation Reactions
-
4.
NMR, IR, UV and MS
- Spectroscopy
-
HNMR
- Nuclear Spin
- Interpreting
- Chemical Shift
- Practice Time! - Chemical Shift
- Equivalency
- Indentifying Homotopic, Enantiotopic and Diastereotopic Protons
- Practice Time! - Equivalency
- Intensity of Signals
- Spin Spin Splitting
- Practice Time! - Spin-Spin Splitting
- Primer on ¹³C NMR Spectroscopy
- Alkanes
- Alkynes
- Alcohols
- Alkenes
- Coupling in Cis/Trans Alkenes
- Ketones
- HNMR Practice 1
- HNMR Practice 2
- HNMR Practice 3
- HNMR Practice 4
- Exchangeable Protons and Deuterium Exchange
- IR - Infrared Spectroscopy
- UV - Ultraviolet Spectroscopy
- Mass Spectrometry
-
5.
General Chemistry
- General Chemistry Lab
- Strategy for Balancing Chemical Reactions
- Calculator Tips for Chemistry
- Significant Figures
- Practice Time! Significant Figures
- Spreadsheets - Getting Started
- Spreadsheets - Charts and Trend lines
- Standard Deviation
- Standard Deviation Calculations
- Factor Labels
- Practice Time! - Factor Labels
- Limiting Reagent Problem
- Percent Composition
- Molar Mass Calculation
- Average Atomic Mass
- Empirical Formula
- Practice time! Empirical and Molecular Formulae
- Initial Rate Analysis
- Practice Time! Initial Rate Analysis
- Solving Equilibrium Problems with ICE
- Practice Time! Equilibrium ICE Tables
- Le Chatelier's
- Practice Time! Le Chatelier's Principle
- 6. Organic Chemistry Lab
- 7. Tools and Reference
-
8.
Tutorials
- Reaction Mechanisms (introduction)
- Factor Labels
- Acetylides and Synthesis
- Drawing Cyclohexane Chair Structures
- Drawing Lewis Structures
- Aromaticity Tutorial
- Common Named Aromatics (Crossword Puzzle)
- Functional Groups (Flashcards)
- Characteristic Reactions of Functional Groups
- Alkyl and Alkenyl Groups
- Valence Bond Theory
- Alkane Nomenclature
-
9.
The Alchemy of Drug Development
- Ivermectin: From Merck Innovation to Global Health Impact
- The Fen-Phen Fix: A Weight Loss Dream Turned Heartbreak
- The Asymmetry of Harm: Thalidomide and the Power of Molecular Shape
- Semaglutide (Ozempic): From Lizard Spit to a Once-Weekly Wonder
- From Cocaine to Novocain: The Development of Safer Local Anesthesia
- The Crixivan Saga: A Targeted Strike Against HIV
- The story of Merck’s COX-2 inhibitor, Vioxx (rofecoxib)
- The Accidental Aphrodisiac: The Story of Viagra
- THC: A Double-Edged Sword with Potential Neuroprotective Properties?
- Ritonavir Near Disaster and Polymorphism
- 10. Allied Health Chem
- 11. Sandbox
Clear History
Quick Menu
Energy Diagrams
Reaction Energy Diagrams
It's convenient to describe chemical reactions with energy diagrams. Reaction energy diagrams are sometimes referred to as potential energy diagrams (PES), reaction coordinate diagrams, energy profile diagrams or free energy diagrams.
In a Reaction Energy diagram, the vertical axis (y-axis) represents energy, which could refer to free energy, enthalpy, or potential energy depending on the type of process being depicted. These diagrams visualize how energy changes as reactants transform into products, with the height on the y-axis indicating the relative energy levels. Higher energy indicates less stable more reactive and lower energy indicates more stable less reactive structures.
The horizontal axis is the "reaction coordinate". It usually traces from left to right the progress of the reaction from reactants to final products. Reaction Energy Diagrams are sometimes referred to as potential energy surfaces (PES).
The horizontal axis of a reaction energy diagram, often labeled as the reaction coordinate or progress of reaction, represents the progression of the reaction from reactants to products. It is a qualitative measure that illustrates the stages of the reaction, starting from the initial state (reactants), through any transition states or intermediates, and ending with the final state (products). The position along this axis does not correspond to time but rather indicates how far along the reaction has proceeded, showing how energy changes during the transformation.
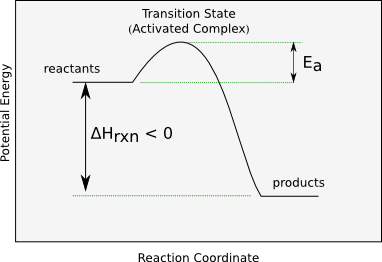
Exothermic Reactions
Reactions that release heat are termed exothermic. In an exothermic reaction, the resulting products have more or more stable bonds than the reactants. The ΔH of reaction for an exothermic reaction is less than zero (ΔHrxn < 0). Recall that ΔHrxn = Hproducts-Hreactants. Thus if the products are lower in energy than the reactants the ΔHrxn will be less than zero. The ΔHrxn is a thermodynamic quantity and tells us nothing about how fast a reaction proceeds.
The rate of a reaction is governed by its Activation Energy or Activation Barrier (Ea). The activation energy (Ea) is the difference in energy between the reactants and the transition state complex. To go from reactants to products you must go over the activation barrier.
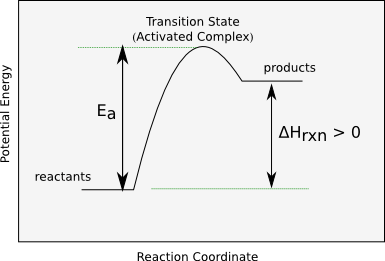
Endothermic Reactions
Reactions that absorb heat are termed endothermic. In an endothermic reaction, the products have less or less stable bonds. The ΔH of reaction for an exothermic reaction is greater than zero (ΔHrxn > 0).
Note chemists also occasionally use the terms endergonic and exergonic. An exergonic reaction has ΔG < 0 and occurs spontaneously, while an endergonic reaction has ΔG > 0 Recall that ΔG is the Gibbs free energy and is defined as follows ΔG = ΔH - TΔS.
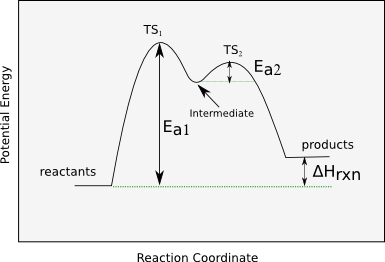
Multi-Step Reactions
The reaction energy diagrams shown above are for single-step reactions. In a single reaction step, there is only one barrier (hump) in the diagram. Likewise, in a two-step reaction, there are two humps or activation barriers. In multistep reactions, the species between both steps is called an intermediate. In the diagram below, the first step is the slowest step, since it has the largest barrier. This is called the rate-determining step (RDS) or rate-limiting step.
Helpful Steps to Create an Energy Diagram
1) Label the axes. The x-axis is labeled as the reaction coordinate, and the y-axis is labeled as energy.
2) Draw a line at the beginning of the graph for the reactants and a line at the end for the products. The products will be higher or lower depending on if the reaction is endothermic or exothermic.
3) Add a hump that connects the reactant and product lines. Remember to add multiple humps if the reaction has multiple transition steps.
4) Label the activation energy, transition step, and enthalpy!
Tips for Drawing Transition States
TODO