- 1. Getting Started
-
2.
First Semester Topics
-
General Chemistry Review
- Introduction
- Electron Configurations of Atoms
- QM Description of Orbitals
- Practice Time - Electron Configurations
- Periodic Trends
- Hybridization
- Closer Look at Hybridization
- Strategy to Determine Hybridization
- Practice Time! - Hybridization
- Formal Charge
- Practice Time - Formal Charge
- Acids-bases
- Practice Time - Acids and Bases
- Hydrogen Bonding is a Verb!
- Electronegativity: The Key to Reactivity
- ESP Maps and Molecular Polarity
-
Structure and Bonding
- Chemical Intuition
- From Quantum Mechanics to the Blackboard: The Power of Approximations
- Atomic Orbitals
- Electron Configurations of Atoms
- Electron Configurations Tutorial
- Practice Time - Structure and Bonding 1
- Lewis Structures
- Drawing Lewis Structures
- Valence Bond Theory
- Valence Bond Theory Tutorial
- Hybridization
- Polar Covalent Bonds
- Formal Charge
- Practice Time - Structure and Bonding 2
- Curved Arrow Notation
- Resonance
- Electrons behave like waves
- MO Theory Intro
- Structural Representations
-
Acids/Base and Reactions
- Reactions
- Reaction Arrows: What do they mean?
- Thermodynamics of Reactions
- Acids Intro
- Practice Time! Generating a conjugate base.
- Lewis Acids and Bases
- pKa Scale
- Practice Time! pKa's
- Predicting Acid-Base Reactions from pKa
- Structure and Acidity
- Structure and Acidity II
- Practice Time! Structure and Acidity
- Curved Arrows and Reactions
- Nucleophiles
- Electrophiles
- Practice Time! Identifying Nucleophiles and Electrophiles
- Mechanisms and Arrow Pushing
- Practice Time! Mechanisms and Reactions
- Energy Diagrams and Reactions
- Practice Time! - Energy Diagrams
- Introduction to Retrosynthesis
-
Alkanes and Cycloalkanes
- Introduction to Hydrocarbons and Alkanes
- Occurrence
- Functional Groups
- Practice Time! Functional Groups.
- Structure of Alkanes - Structure of Methane
- Structure of Alkanes - Structure of Ethane
- Naming Alkanes
- Practice Time! Naming Alkanes
- Alkane Isomers
- Relative Stability of Acyclic Alkanes
- Physical Properties of Alkanes
- Ranking Boiling Point and Solubility of Compounds
- Conformations of Acyclic Alkanes
- Practice Time! Conformations of acyclic alkanes.
- Conformations of Cyclic Alkanes
- Naming Bicyclic Compounds
- Stability of Cycloalkane (Combustion Analysis)
- Degree of Unsaturation
- Alkane Isomers
-
Stereochemistry
- Enalapril in ACE
- Constitutional and Stereoisomers
- Chirality or Handedness
- Drawing a Molecules Mirror Image
- Exploring Mirror Image Structures
- Enantiomers
- Drawing Enantiomers
- Practice Time! Drawing Enantiomers
- Identifying Chiral Centers
- Practice Time! Identifying Chiral Molecules
- CIP (Cahn-Ingold-Prelog) Priorities
- Determining R/S Configuration
- Diastereomers
- Meso Compounds
- Fischer Projections
- Fischer Projections: Carbohydrates
- Measuring Chiral Purity
- Practice Time! - Determining Chiral Purity and ee
- Chirality and Drugs
- Chiral Synthesis
- Prochirality
- Converting Fischer Projections to Zig-zag Structures
- Practice Time! - Assigning R/S Configurations
-
Alkenes and Addition Reactions
- The Structure of Alkenes
- Alkene Structure - Ethene
- Physical Properties of Alkenes
- Naming Alkenes
- Health Insight - BVO (Brominated Vegetable Oil)
- E/Z and CIP
- Stability of Alkenes
- H-X Addition to Alkenes: Hydrohalogenation
- Practice Time - Hydrohalogenation
- X2 Addition to Alkenes: Halogenation
- HOX addition: Halohydrins
- Practice Time - Halogenation
- Hydroboration/Oxidation of Alkenes: Hydration
- Practice Time - Hydroboration-Oxidation
- Oxymercuration-Reduction: Hydration
- Practice Time - Oxymercuration/Reduction
- Oxidation and Reduction in Organic Chemistry
- Calculating Oxidation States of Carbon
- Identifying oxidation and reduction reactions
- Practice Time - Oxidation and Reduction in Organic
- Oxidation
- Reduction
- Capsaicin
-
Alkynes
- Structure of Ethyne (Acetylene)
- Naming Alkynes
- Practice Time! - Naming Alkynes
- Physical Properties of Alkynes
- Preparation of Alkynes
- Practice Time! - Preparation of Alkynes
- H-X Addition to Alkynes
- X2 Addition
- Hydration
- Reduction of Alkynes
- Practice Time! - Addition Reactions of Alkynes
- Oxidative Cleavage of Alkynes
- Alkyne Acidity and Acetylide Anions
- Reactions of Acetylide Anions
- Retrosynthesis Revisted
- Practice Time! - Multistep Synthesis Using Acetylides
-
Alkyl Halides and Alcohol
- Naming Alkyl Halides
- Naming Alcohols
- Classes of Alcohols and Alkyl Halides
- Practice Time! - Naming Alkyl Halides
- Practice Time! - Naming Alcohols
- Physical Properties of Alcohols and Alkyl Halides
- Structure and Reactivity of Alcohols
- Structure and Reactivity of Alkyl Halides
- Preparation of Alkyl Halides and Tosylates from Alcohols
- Practice Time! - Alcohols to Alkyl Halides
- Preparation of Alkyl Halides from Alkenes; Allylic Bromination
- Strategy for Predicting Products of Allylic Brominations
- Practice Time! - Allylic Bromination
-
Substitutions (SN1/SN2) and Eliminations (E1/E2)
- Introduction
- Solvents
- SN1 Reaction: The Carbocation Pathway
- SN2 Reactions: The Concerted Backside Attack
- SN1 vs. SN2: Choosing the Right Path
- Application: Cardura (Doxazosin)
- E1 Reactions: Elimination via Carbocations
- E2 Reactions: The Concerted Elimination
- E1cB: The Conjugate Base Elimination Pathway
- Substitution versus Elimination
-
Dienes, Allylic and Benzylic systems
- Allyl Cations, Anions and Radicals
- Allyl and Vinyl Groups
- Allylic Halogenation
- SN1 and SN2 Reactions of Allylic Halides and Tosylates
- Diels Alder Reaction
- Electrophilic Addition - 1,2 versus 1,4
- π-Molecular Orbitals and Conjugation
- Kinetic versus Thermodynamic Control: HBr Addition to 1,3-Butadiene
- Naming Polyenes
-
General Chemistry Review
-
3.
Second Semester Topics
- Arenes and Aromaticity
-
Reactions of Arenes
- Electrophilic Aromatic Substitution
- EAS-Halogenation
- EAS-Nitration
- Practice Time - Synthesis of Aniline
- EAS-Alkylation
- Practice Time - Friedel Crafts Alkylation
- EAS-Acylation
- Practice Time - Synthesis of Alkyl Arenes
- EAS-Sulfonation
- Practice Time - EAS
- Donation and Withdrawal of Electrons
- Regiochemistry in EAS
- Practice Time - Directing Group Effects
- Synthesizing Disubstituted Benzenes: Effects of Substituents on Rate and Orientation
- Steric Considerations
- Strategies for Synthesizing Disubstituted Benzenes
- NAS - Addition/Elimination
- NAS - Elimination/Addition - Benzyne
- Alcohols and Phenols
-
Ethers and Epoxides
- Intro and Occurrence
- Crown Ethers and Cryptands
- Preparation of Ethers
- Reactions of Ethers
- Practice Time - Ethers
- Preparation of Epoxides
- Reactions of Epoxides - Acidic Ring Opening
- Practice Time - Acidic Ring Opening
- Reactions of Epoxides - Nucleophilic Ring Opening
- Practice Time - Nucleophilic Ring opening
- Application - Epoxidation in Reboxetine Synthesis
- Application - Nucleophilic Epoxide Ring Opening in Crixivan Synthesis
- Physical Properties of Ethers and Epoxides
- Naming Ethers and Epoxides
-
Aldehydes and Ketones
- Naming Aldehydes and Ketones
- Physical Properties of Ketones and Aldehydes
- Practice Time - Naming Aldehydes/Ketones
- Nucleophilic addition
- Addition of Water - Gem Diols
- Practice Time - Hydration of Ketones and Aldehydes
- Addition of Alcohols - Hemiacetals and Acetals
- Acetal Protecting Groups
- Hemiacetals in Carbohydrates
- Practice Time - Hemiacetals and Acetals
- Addition of Amines - Imines
- Addition of Amines - Enamines
- Practice Time - Imines and Enamines
- Application - Imatinab Enamine Synthesis
- Addition of CN - Cyanohydrins
- Practice Time - Cyanohydrins
- Application - Isentress Synthesis
- Addition of Ylides - Wittig Reaction
- Practice Time - Wittig Olefination
- Structure of Ketones and Aldehydes
- Carboxylic Acids and Derivatives
- Enols and Enolates
- Condensation Reactions
-
4.
NMR, IR, UV and MS
- Spectroscopy
-
HNMR
- Nuclear Spin
- Interpreting
- Chemical Shift
- Practice Time! - Chemical Shift
- Equivalency
- Indentifying Homotopic, Enantiotopic and Diastereotopic Protons
- Practice Time! - Equivalency
- Intensity of Signals
- Spin Spin Splitting
- Practice Time! - Spin-Spin Splitting
- Primer on ¹³C NMR Spectroscopy
- Alkanes
- Alkynes
- Alcohols
- Alkenes
- Coupling in Cis/Trans Alkenes
- Ketones
- HNMR Practice 1
- HNMR Practice 2
- HNMR Practice 3
- HNMR Practice 4
- Exchangeable Protons and Deuterium Exchange
- IR - Infrared Spectroscopy
- UV - Ultraviolet Spectroscopy
- Mass Spectrometry
-
5.
Tools and Reference
- 2D Editor
- 3D Model Kit
- Molar Mass Calculator
- Newman Projection Tool
- Fischer to Zigzag
- Chromatograph Simulator
- TLC Simulator
- Periodic Table
- Sig Fig Calculator
- Degree of Unsaturation Calculator
- Chemical Reaction Kinetic Simulator
-
Reagents
- Named Reactions
- pKa Values
- Heterocycles
- Bond Dissociation Energies
- 6. Tutorials
-
7.
The Alchemy of Drug Development
- Ivermectin: From Merck Innovation to Global Health Impact
- The Fen-Phen Fix: A Weight Loss Dream Turned Heartbreak
- The Asymmetry of Harm: Thalidomide and the Power of Molecular Shape
- Semaglutide (Ozempic): From Lizard Spit to a Once-Weekly Wonder
- From Cocaine to Novocain: The Development of Safer Local Anesthesia
- The Crixivan Saga: A Targeted Strike Against HIV
- The story of Merck’s COX-2 inhibitor, Vioxx (rofecoxib)
- The Accidental Aphrodisiac: The Story of Viagra
- THC: A Double-Edged Sword with Potential Neuroprotective Properties?
- Ritonavir Near Disaster and Polymorphism
Clear History
Newman and Sawhorse Projections
Sawhorse and Newman Projections
So far, we've looked at 3D models spinning around in space, but when you're sitting down with a pencil or working through a problem set, you need a reliable way to represent these 3D relationships on a flat page. That’s where projection formulas come in. When we want to analyze what's happening along a specific carbon-carbon bond axis, our two best tools are Sawhorse projections and Newman projections.
The Sawhorse Projection
A sawhorse projection gives you a tilted, perspective view of the entire molecule down the C–C single bond axis. Imagine looking slightly down from above: the front carbon's bonds jut out toward you, while the back carbon's bonds recede away into the distance. Nothing is hidden, making it a great stepping stone for visualizing spatial arrangements.
Depending on how the molecule is twisted, a sawhorse projection of ethane will look like one of two things:
- Staggered Conformation: The bonds on the front carbon and the back carbon are neatly offset (at 60° dihedral angles). The hydrogen atoms on the front are spaced as far apart as possible from the hydrogens on the back, minimizing steric crowding and maximizing that stabilizing hyperconjugative overlap we talked about.

- Eclipsed Conformation: The bonds on the front carbon and the back carbon line up directly behind one another (at a 0° dihedral angle). The front hydrogens completely "eclipse" the back hydrogens, creating maximum torsional strain.

The Newman Projection
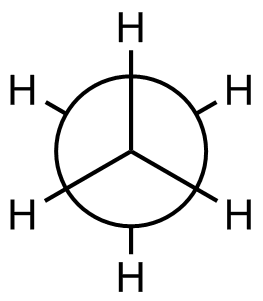
While sawhorse projections give you a great side-angle perspective, sometimes you need to look straight down the barrel of a specific carbon-carbon bond to really see what's colliding or overlapping. That’s where the Newman projection comes in.
Imagine shrinking down and placing your eye directly in front of the front carbon, looking straight down the C–C bond axis toward the back carbon:
- The front carbon is represented simply by the point where three bonds intersect.
- The back carbon is represented by a large circle hiding behind the front one. The three bonds attached to the back carbon only peek out from the outer edge of that circle.
Newman projections strip away all the perspective clutter, making it instantly obvious whether a molecule is staggered (comfortable, lower energy, great hyperconjugative overlap) or eclipsed (strained, higher energy).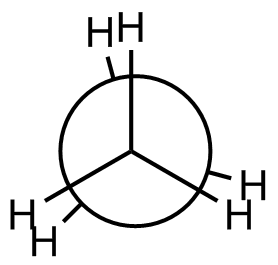
Exploring Conformations with the Newman App
To really understand how molecular shape dictates energy, you can't just look at a static picture—you have to watch it twist. The interactive Newman projection app lets you step through rotations around the central C–C bond and see how the energy shifts in real-time. You can also swap out the backbone to see how adding bulkier substituents changes the entire game, moving from simple ethane to propane, and up to butane.